Using Annotations
Objective Chart has an innovative system for annotating charts. All labels used on data items or for axes may be given multiple text strings that can be accessed by a simple integer code. The purpose of this system is to allow charts to be distributed with many different languages embedded in the data. The access code is designed to be the same as the telephone dialing code for the country in which the chart is being displayed.
For example, your corporate headquarters in New York can distribute charts to all of its U.S. subsidiaries and send the same charts, with the same data, to the offices in Europe and Asia. When the charts are displayed, the annotations appear in the correct language of the country. This assumes that the application has supplied text strings for each country.
The individual text strings are tagged with an integer code and stored as CString objects. A specialized list class manages the collection of multilingual annotations. Every SRGraphData, SRGraphDynamicData, and SRGraphDataList has an annotation list associated with it. SRGraph also has an annotation list that is displayed as the chart title.
Annotations can be multiple line text. Use the new line character \n within the CString to separate lines.
SRGraphAnnotationList
SRGraphAnnotationList manages a variable size list of coded text items. Adding or modifying items should be performed via the member functions in this class. This ensures that there is only one text string with a particular code. For example, you should not have two annotations in a list which are tagged 44 (United Kingdom). If this should happen because some editing or initialization forces the codes to be identical on two strings, the annotation list will only find or recognize the first one in the list.
SRGraphAnnotation
SRGraphAnnotation is a simple class that contains a string of text and an integer code by which it is identified. This class is normally used only in conjunction with the SRGraphAnnotationList class.
Supporting Multiple Languages or Audiences
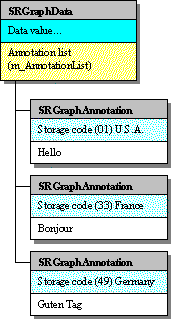
To better illustrate the concept of a multilingual annotation,
Figure 107 shows how the
SRGraphData class stores its annotations.
In principal, there are no limits to the number of annotations you can have in a data object. Limitations are defined by memory size and disk space.
Note also that the use of country codes for identifiers is only a recommendation and not a requirement. You can annotate charts so that the labels are selected according to any numbering system you choose.
The following code sample sets annotations for the data objects in group 0 in two languages or countries – USA (code 01) and France (code 33).
char *c[10][2]={
{"one","un"},
{"two","deux"},
{"three","trois"},
{"four","quatre"},
{"five","cinq"},
{"six","six"},
{"seven","sept"},
{"eight","huit"},
{"nine","neuf"},
{"ten","dix"}};
CString s;
for(int x=0;x<8;x++)
{
for(int g=0; g<2; g++)
{
m_Graph.SetValue(x,g,7.+.1*x+.05*g);
}
s.Format("%d", x+1);
m_Graph.GetSafeData(x,0)-> SetAnnotation(1,c[x][0]);
m_Graph.GetSafeData(x,0)-> SetAnnotation(33,c[x][1]);
}
Where Annotation Lists Are Used
Each SRGraphData data item has an annotation list. Therefore, any data item may be given an annotation. Not all chart types use or display the text supplied to the data objects, but charts that you design yourself have the facility to do so if needed.
In addition to the data items, each data list SRGraphDataList has an annotation list that provides header text for individual chart series or groups.
Some components use annotation lists. SRGraphLabel uses a list to display its labels in the selected language.
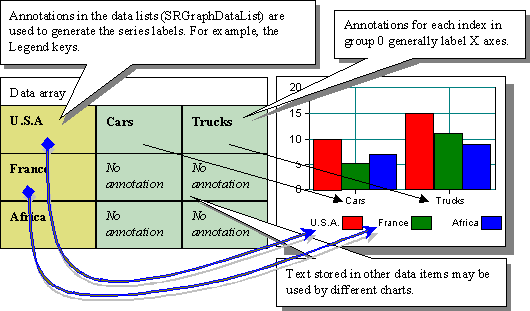
Annotations held in the data array are used to provide text for the chart axes and legends.
Figure 108 shows how annotations are employed.


