Chapter 22 Data Rolling
Performance Monitor
A common type of chart is the Performance Monitor. A performance monitor dynamically displays the last N observations of a particular variable. A stock’s closing price over the last three months, sales for the last 12 quarters, or the temperature in a mixing vat over the past hour are candidates for display in a performance monitor.
After a set number of observations are acquired, the oldest data value is lost when a new data value is added. A particular data value seems to roll from one side of the chart to the other. The graph types that use an indexed x-axis (line, vertical bar, area, etc.) are the easiest to roll.
Objective Chart’s Standard data model, which stores data objects in a linked list (SRGraphDataList), is ideal for this rolling operation. Data stored using the Dynamic data model (SRGraphDynamicData) can also be rolled, just not as efficiently. External data accessed using the Structure data model (SRGStructureData or its derivatives) cannot be rolled.
SRGraph::RollGroup() calls the Roll() function of the selected group (SRGraphDataList or SRGraphDynamicData). The entire group may be rolled toward the lower or higher indices so charts like performance monitors can be implemented. As the data is shifted by one place, an empty space is created at one end or the other of the group. This place may be filled with a new data value as the roll takes place, thereby creating a continuously scrolling data series.
The following code is an example of an event handler— OnTimer() in this case— that acquires a new data value and adds it to the displayed data list by rolling. See the PMon sample application for the full implementation.
static nCount = 100; // initial size of data list
void CPMonView::OnTimer(UINT nIDEvent)
{
// acquire new data value
dNewValue = rand() % 500;
// roll group 0 toward lower indices
// and add dNewValue to the end
m_Graph.RollGroup(0,dNewValue, FALSE);
// Standard data model only
// Set annotation for axis label
CString s;
s.Format("%d",nCount++);
m_Graph.GetGroup(0)->GetIndex(99)-> SetAnnotation(s);
Invalidate();
}
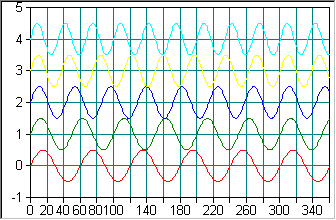
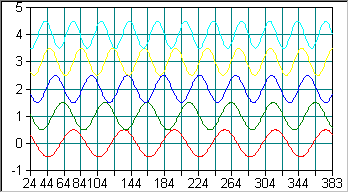
Figure 149 and
Figure 150 show some generated signals before and after rolling several times.