Component Classes
Objective Chart uses a component-based drawing architecture. Components are display-panel primitives that may be positioned on-screen or on the printer page. They include attributes that manage background, border, and foreground appearance. Various component classes are provided to support features of presentation-style charts. A single panel can represent the whole chart or many panels may be assembled to make a presentation chart or multiple chart windows.
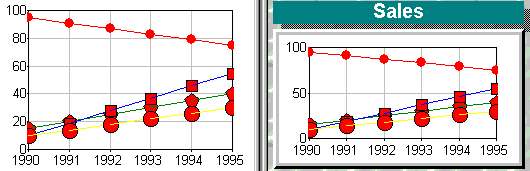
The figure below shows two graphs generated from the same data. The image on the left uses a single display component. The image on the right uses a set of panels arranged to form a presentation style chart.
The basic component panel is positioned by a specialized rectangle class, SRGRect. This class uses floating point numbers to define the left, top, right, and bottom extents in a similar way to the MFC CRect object. Because the rectangle uses a floating-point coordinate system, the panels may be placed using one of four measurement units. These are pixels, millimeters, inches, or a percentage of the available window area.
Each component has a background pane that can be filled with solid colors, color gradients, or tiled or stretched images. Each component panel also has a border and shadow that can be drawn in a variety of styles. Style selections are kept in an SRGraphStyle object.
Objective Chart supplies a variety of specialized component classes that allow you to add a background frame, title, labels, and a legend to a chart. The display component handles the drawing of the axes, labels, and data items for all the available graph and axis types. The component classes are discussed individually in the following sections.
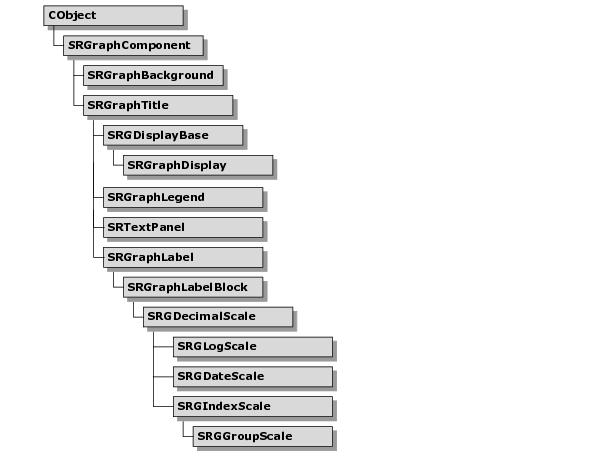
Figure 7 shows the hierarchy for the Objective Chart component and axis drawing classes.
SRGraphComponent
As the base for all other component classes, the SRGraphComponent class defines the basic functionality common to all components.
SRGraphComponent manages a moveable, sizeable panel that holds the basic graphic functionality of the component system. The basic component fills its background and draws borders and shadows around the panel. The component also holds the various routines for drawing chart bars in 2D and in orthogonal 3D, drawing styled lines and chart symbols, serializing itself via the MFC archive system, and saving or loading a template of itself via a CStdioFile.
Each component also maintains a pointer to its parent SRGraph object. This pointer is set when the component is added to the SRGraph component list. The pointer gives the component access to its parent graph object and thus to all the other components on the list.
While it is not a true abstract class, the SRGraphComponent class must always be derived from and never used as-is on the component list. Several virtual functions will ASSERT unless they are overridden to perform a useful job.
SRGraphBackground
SRGraphBackground is the simplest of all the derived components. Its task is to provide a panel upon which other items may be drawn. It has no extra functionality over SRGraphComponent except to write its name to a template file.
SRGraphTitle and SRGraphTitleResizeable
SRGraphTitle provides a panel upon which the chart title may be displayed. Member functions automatically update the chart title if it changes. This class also provides the font support for displaying text. Therefore, any component that displays text is derived from SRGraphTitle.
The title component displays the text stored in the parent graph object, by default. It can also be set to display its own text, allowing multiple titles to be used in a chart.
SRGraphTitleResizeable is derived from SRGraphTitle, which can optionally adjust its component rectangle to fit the displayed text.
SRGraphDisplay
SRGraphDisplay is the standard display component. Most of your work with Objective Chart will involve this component and its style member. SRGraphDisplay (and its abstract base class, SRGDisplayBase) perform the drawing functions for all the various graph and axis types. If additional functionality is required, SRGraphDisplay is the class that is usually overridden.
SRGraphLegend
SRGraphLegend displays legend information by drawing annotations and colored keys. The SRGraphLegend component has a special ability to connect to any SRGraphDisplay component that immediately precedes it in the component list. If SRGraphLegend finds a suitable SRGraphDisplay, it displays the best legend it can for the chart type and data scope currently set in the display. Therefore, an acceptable legend can often be added to a chart with little effort.
SRGTextPanel
The SRGTextPanel class provides a multi-line text box with an adjustable title. The text panel component can optionally resize itself to fit the displayed text.