Data Storage Classes
Conceptually, data is stored in Objective Chart as a two-dimensional array. The array is specially designed to be similar to the grid of cells in a spreadsheet or in a grid control. Although Objective Chart was designed to work with the Objective Grid system, it works equally well in a stand-alone application.
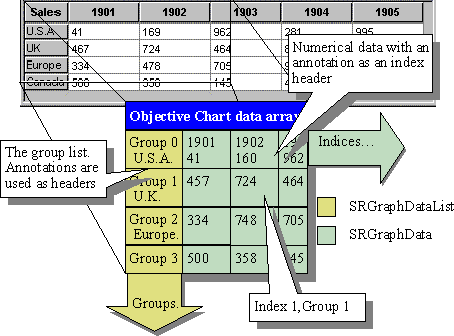
For example, consider the yearly sales data in the figure below. There is a row for each country in which the company sells. There is a column for each of five calendar years. A common graph of this data would display a numerical scale representing the range of the sales figures along the vertical axis with labels for the years along the horizontal axis. The yearly data for each country would generally be displayed using wigets or bars of the same shape and color. The wigets of the same country may be connected by lines.
A particular data item is referenced by its group (row) and its position or index within the group or list. The set of data items with the same index from all the available groups are called indices (a column).
NOTE >> Objective Chart uses zero-based group and index numbers for referencing a particular data object. Conversely, Objective Grid uses one-based indices to refer grid cells.
Objective Chart supports three models for storing and accessing data values. The Standard system is described below. A complete discussion of the other two models is deferred to
Chapter 8, “Data Storage Models.” That chapter also covers the methods for accessing (adding, changing, and deleting) data from the chart.
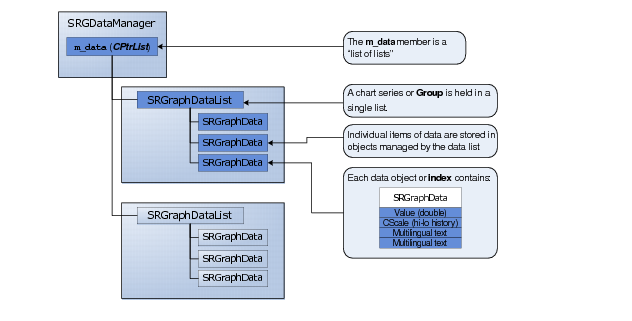
In the Standard system, each data value is stored in an individual SRGraphData object. In addition to the numeric value, the SRGraphData class includes members that contain style settings, multilingual annotations, a hi-low history, and a null flag. The data objects for each group are stored in an SRGraphDataList, based on CObList. SRGDataManager’s m_data member is a CPtrList that stores pointers to the SRGraphDataLists for each group of data.
Figure 10 details the relationships between
SRGraphDataList and
SRGraphData.
The SRGraphDataList, SRGraphData, and CScale classes are used in the Standard data storage model.
SRGraphDataList
SRGraphDataList is the basic unit for the storage of a complete chart series. Based upon the standard MFC CObList class, it holds a variable length list of data objects. In this document, you will see references to groups and indices. This SRGraphDataList object is often referred to as a group. The class has a style member that is used by a few graph types to determine the appearance of all the data items in the group, and an annotation list that provides a multi-lingual group header.
Group headers often provide text for labels displayed beside keys in a legend. A few graph types use group headers as axis labels (see SRGGroupScale).
SRGraphData
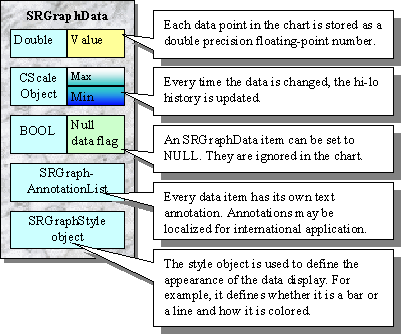
Generally, data values are stored as double precision floating point numbers. The basic form of storage utilized by SRGraph is managed by the SRGraphData class. SRGraphData stores one number, some text to associate with the number, and a style object. It also contains an object (CScale) that accumulates the highest and lowest values that have been stored in the data object and a flag that may be set to signify that the numerical data is null or invalid. Depending on the graph type, the style member may be used to determine how the individual data item appears in the chart.
The annotations of the individual data objects can be displayed as chart tips. For a pie chart, they supply labels for the pie wedges. A number of chart types get their axis labels from the annotations of the first group (see SRGIndexScale).
Figure 11 shows how the standard
SRGraphData object is arranged.
CScale
CScale is a utility class that keeps a record of the maximum and minimum values added to it. A CScale object starts from an empty or zeroed state. Data values are added to it using overloaded += operators. Each addition updates the maximum and minimum values of the class. After several data values have been added over time, the range or hi-low history of those values is retained.
A CScale object is a member of each SRGraphData data item. The CScale member retains the minimum and maximum values that have been assigned to the data item over time. These values are plotted by the Stock chart.
Internally, Objective Chart uses CScale objects to store numerical ranges of various types, including the range of an axis scale.