Objective Chart Editor
The Chart Editor is a collection of classes dedicated to chart editing functions. Driven by the
SRGraphEditDialog class, it provides a simple method for modifying data, component lists, and annotations.
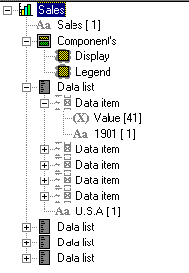
Figure 122 shows the Chart Editor’s main interface.
You can see an example of the Chart Editor in use in the ExData sample program.
Double-clicking on an icon in the Chart Explorer window brings up properties for that item. For example, the property dialog for a component allows the component’s rectangle and its fill, border, and shadow styles to be changed. The property dialog for a data object can select its object style and fill style.
A right-click brings up various context sensitive menus. For example, a right-click on the main component list object brings up a menu that allows new components to be added. A right-click on a component object allows the component’s position in the component list to be changed. A right-click on a data object can add an annotation for the object.
The component list can also be stored in a file on disk as a text template for later reuse. The stored template can be reloaded by the same or different application. Or it can be incorporated in another application’s resources. Using templates this way makes it easy to create many charts with a consistent appearance.
The Chart Editor is not a separate program. It is an integral part of the Objective Chart class library and may be easily added to chart applications.
To make the Chart Editor available in your application:
• Create a menu item with the predefined resource identifier, ID_GRAPH_EDIT = 0xd101.
• The message map in the view classes connects this command message with the function OnGraphEdit(), which displays the Chart Editor dialog. No other coding is required.