Chart Tips
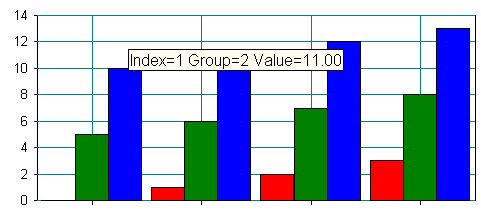
Similar in appearance to a ToolTip window, the
SRGraphTip or chart tip is invoked by the
SRGraphView class to provide feedback about chart data items.
Figure 127 shows a view and a chart tip in action.
Using Chart Tips
Whenever the mouse pointer remains stationary for 1.5 seconds, SRGraphView::OnTimer() is called. OnTimer() checks to see if the mouse pointer is on a data item— that is, if the mouse’s point on the screen is contained in any of the regions stored in the SRGraphFeedback objects in the feedback list. If the mouse pointer is on a data item, OnTimer() calls ShowFeedback().
ShowFeedback() uses the information in the SRGraphFeedback object to access the indicated data item. It obtains additional information by creating an SRGraphPosition object. Depending on the chart type returned by SRGraphPosition, ShowFeedback() formats a CString object containing relevant information about the data object.
The Objective Chart view classes contain a member variable of type SRGraphTip, which is based on CWnd. ShowFeedback() passes its text string to the graph tip window. The graph tip window displays the text near the data item until the mouse pointer moves, or until five seconds pass. Then the chart tip window is destroyed. The SRGraphTip displays the text using the system font.
Customizing Chart Tips
Changing the Text in Chart Tips
By default, chart tips display the data item’s value, group, and index, if available, depending on the chart type. To change the format or content of the displayed text, override the ShowFeedback() function in your view class (derived from SRGraphView or SRGScrollView). A sample is shown below.
void CChartExView::ShowFeedback(SRGraphFeedback* pFeedback)
{
CChartExDoc *pDoc=GetDocument();
CString strText;
// format the chart tip as you like
double value =pDoc->m_Graph.GetGroup(pFeedback-> m_nGroup)->
GetIndex(pFeedback->m_nIndex)->GetValue(),
strText.Format("Tide=%g ft (%g Meters)", value,
value*304.8/1000.);
CPoint tPoint=m_MousePoint;
// Don’t forget this conversion
ClientToScreen(&tPoint);
m_GraphTip.ShowTip(strText,tPoint,this);
}
NOTE >> Chart tips can now display multiple lines of text. The new line character (\n) serves as a line separator.
Changing the Appearance of Chart Tips
To change the chart tip text color and the background color, use the member functions SetTextColor() and SetBKColor().
Changing the Delay Time for Displaying Chart Tips
The OnMouseMove() function in the Objective Chart view classes kills and resets a special timer event. Thus, after the mouse remains stationary (no mouse move events) for a specified time interval (default=1.5 seconds), the timer event occurs. The OnTimer() handler kills the timer and calls ShowFeedback() to display a chart tip.
To change the delay time for displaying chart tips, override the OnMouseMove() function of the view class and change the parameter of SetTimer().
The SRGraphTip::ShowTip() function sets another timer that determines how long the chart tip is displayed. After the specified time interval (default=5 seconds), OnTimer() calls EraseTip(), which destroys the chart tip window. SRGraphTip::OnMouseMove() also destroys the chart tip window when the mouse is moved.
Changing a Chart Tip’s Maximum Display Duration
SRGraphTip now has a SetTipTime() function that you can use to change the SetTimer() parameter in ShowTip(). To change the maximum duration that a chart tip is displayed, call SetTipTime() for the m_GraphTip member of the view class from OnInitialUpdate() or ShowFeedback(). For example,
m_GraphTip.SetTipTime(10000); // display tip for up to 10 seconds


