Histogram Chart
The OCHistogram class creates a bar chart that counts the distribution of values in a given set of data.
The Histogram chart performs the data analysis in two stages. During the first stage, data is scanned to determine the overall range of the data values. This range is divided into a number of subdivisions or slots. The number of data slots may be programmed using the SetDataDivisions() function. During the second stage, counters for these slots are incremented once for each data value that falls within a particular slot range.
Using the Histogram Chart
Data is supplied to the chart item by item. First the whole data set or the range of data is sent to the AddToScan() function. This sets up the scale. Then the data is sent one value at a time to the AddData() function which sorts the values into their correct slots. Once this data is scaled and sorted, the chart is drawn in the normal way by calling the DrawComponentList() function via the Paint() function in the OCUTItem class.
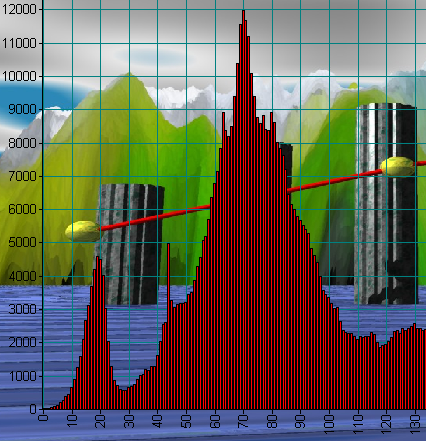
Figure 134 and the code example following it show how the histogram chart is used to generate a histogram of the colors in an image stored in a resource bitmap.
BITMAP bitmap;
// create an OCHistogram object somewhere in the app
OCHistogram_Histogram;
// load the bitmap to be analyzed
CBitmap bm;
bm.LoadBitmap(IDB_BITMAP1);
CDC mdc; //=GetDesktopWindow()->GetDC();
mdc.CreateCompatibleDC(pDC);
CBitmap *pOldbm=(CBitmap *)mdc.SelectObject(&bm);
CRect r;
GetClientRect(&r);
bm.GetBitmap(&bitmap);
int nOldMode=pDC->SetStretchBltMode(COLORONCOLOR);
pDC->StretchBlt(0, 0, r.Width(), r.Height(), &mdc, 0, 0, bitmap.bmWidth,
bitmap.bmHeight, SRCCOPY);
pDC->SetStretchBltMode(nOldMode);
// set up the Histogram chart
m_Histogram.GetGraph()->SetBackgroundDraw(FALSE);
m_Histogram.SetDataDivisions(256);
m_Histogram.ResetScan();
// this sets up the data range.
// this method is used because we know the range to expect
// it is also considerably faster than the full scan
m_Histogram.AddToScan(255);
m_Histogram.AddToScan(0);
m_Histogram.InitializeData();
// this does the real data
for(int y=0;y<bitmap.bmHeight;y++)
{
for(int x=0;x<bitmap.bmWidth;x++)
{
COLORREF color=mdc.GetPixel(x,y);
m_Histogram.AddData((double)( color & 0xff));
}
}
// display the bar chart
m_Histogram.Paint(pDC,this);
mdc.SelectObject(pOldbm);
bm.DeleteObject();


