Charts > Using the Charts Library > Data Display > Using Single Displayers > High-Low Bar Displayer
 
High-Low Bar Displayer
A high-low bar displayer has the following basic characteristics:
Class
Category
Single
Inherits from
Number of real data sets displayed
2
Can be used with all types of projections
Yes
Items drawn
High-low bar items
As with the high-low displayer, the high-low bar displayer displays two data sets. The first data set is composed of the low values and the second data set is composed of the high values. A high-low bar item is drawn between each pair of low-high values, the low values being taken in order from the first data set and the high values being taken in order from the second data set.
High-Low Bar Displayers in a Cartesian Chart and in a Polar Chart illustrates the fact that a high-low bar displayer can be used with all types of projections. Data sets are represented by a high-low bar displayer in a Cartesian chart (using a Cartesian projection) and in a polar chart (using a polar projection).
High-Low Bar Displayers in a Cartesian Chart and in a Polar Chart
We can use the high-low bar displayer displaying the white high-low bar items outlined in green and red as an example. We can create this displayer by using the following code:
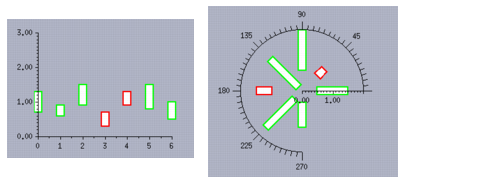
IlvPalette* risePal = dpy->getPalette(dpy->getColor("white"),
dpy->getColor("green"),0,0,0,0,2);
IlvPalette* fallPal = dpy->getPalette(dpy->getColor("white"),
dpy->getColor("red"),0,0,0,0,2);
IlvHiLoBarChartDisplayer* displayer =
new IlvHiLoBarChartDisplayer(IlvChartDisplayerWidth,
risePal,
fallPal);
Note: By default, the high-low bar items are outlined with the foreground color of the defined rise and fall palettes and are filled with the background color of these palettes. The high-low bar items will be displayed only with the outline if the Drawn Filled property is set to IlvFalse.

Version 6.1
Copyright © 2016, Rogue Wave Software, Inc. All Rights Reserved.