FIRDESIGN Function (PV-WAVE Extreme Advantage)
Designs windowed, finite impulse response (FIR) digital filters including lowpass, highpass, bandpass, and bandstop filters.
Usage
result = FIRDESIGN(w, f1 [, f2])
result = FIRDESIGN(m, f1 [, f2])
Input Parameters
w—A one-dimensional array containing a window sequence.
m—The filter length.
f1—The frequency band edge for lowpass and highpass filters, or the lower frequency band edge for bandpass and bandstop filters.
f2—The upper frequency band edge for bandpass and bandstop filters.
Returned Value
result—A filter structure containing an FIR filter.
Keywords
Bandpass—If present and nonzero, designs a bandpass filter.
Bandstop—If present and nonzero, designs a bandstop filter.
Highpass—If present and nonzero, designs a highpass filter.
Lowpass—If present and nonzero, designs a lowpass filter.
Discussion
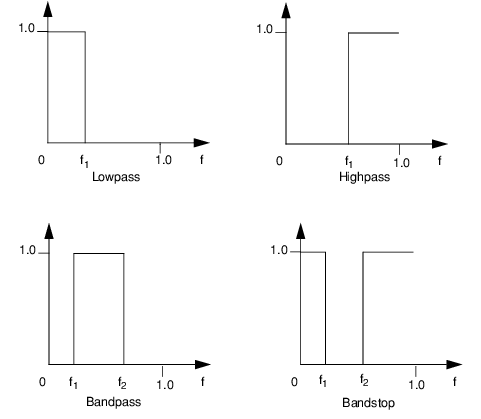
FIRDESIGN designs linear phase FIR filters to approximate the ideal lowpass, highpass, bandpass, and bandstop filters shown in
Figure 2-6: Ideal Lowpass, Highpass, Bandpass, and Bandstop Filters on page 58.
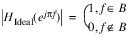
The basic approximation technique begins with one of the four ideal frequency responses:
for an appropriate frequency set B. The impulse response:
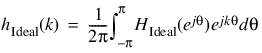
,
(θ =
πf
)
is determined and multiplied by a window sequence w(k), with the result:
b(k) = w(k)hIdeal(k)
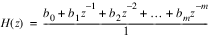
The values of b(k) are returned in the filter structure as:
If the first parameter in the calling sequence is an array of length m, an FIR filter of length m is designed using this array as the window sequence. If the first parameter is an integer m, then by default an FIR filter of length m is designed using a Hanning window.
Example
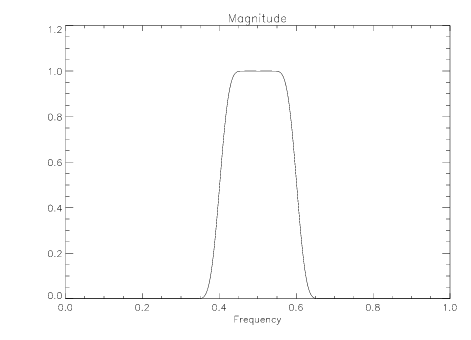
In this example, FIRDESIGN is used to approximate an ideal bandpass filter with band edges 0.4 and 0.6 using a Blackman window. The results are shown in
Magnitude of Frequency Plot.
; Compute a Blackman window sequence of length 101.
w = FIRWIN(101, /Blackman)
; Approximate an ideal bandpass filter with band edges 0.4
; and 0.6 using a Blackman window.
h = FIRDESIGN(w, 0.4, 0.6, /Bandpass)
hf = FREQRESP_Z(h, Outfreq = f)
; Plot the magnitude of frequency response.
PLOT, f, ABS(hf), Title = 'Magnitude', XTitle = 'Frequency'
See Also
For Additional Information
Mitra and Kaiser, 1993, section 4.4.
Oppenheim and Schafer, 1989, section 7.4.
Version 2017.0
Copyright © 2017, Rogue Wave Software, Inc. All Rights Reserved.