FIRFILT Function (PV-WAVE Extreme Advantage)
Applies a finite impulse response (FIR) filter to a sequence.
Usage
result = FIRFILT(h, x)
Input Parameters
h—A filter structure containing an FIR filter.
x—A one-dimensional array containing the data signal to be filtered.
Returned Value
result—A one-dimensional array of the same length as x containing the filtered data.
Keywords
Full—If present and nonzero, the entire result of the convolution of the signal with the filter is returned.
note | Full is not valid if keyword Periodic is also set. |
Offset—The result is shifted by the offset after the filter operation. (Default: N_ELEMENTS(h.b)/2)
Periodic—If present and nonzero, x is treated as periodic.
Discussion
For a given filter structure of the form:
H(z) = B(z)/A(z) with A(z) = 1
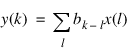
FIRFILT computes the output sequence y(k) from the input sequence x(l) as:
where bk are the coefficients of B(z).
Function CONVOL1D is used to carry out this computation. In order to reduce end effects, a portion of the result of the convolution operation is removed from the beginning and the end of the filtered signal before being returned. Use keyword Offset to adjust how the elements are removed.
The length of result is the same as the input parameter x by default. To return the entire result of the convolution operation, use keyword Full.
Example
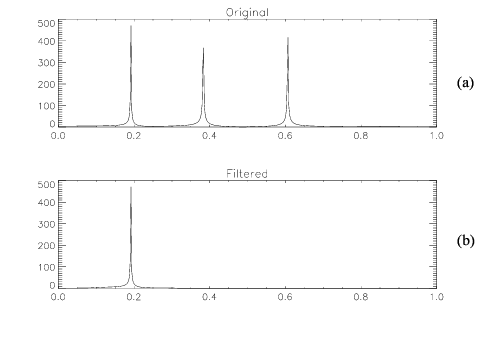
This example illustrates a typical application of FIRFILT. The results are shown in
FIRFILT Example, where (a) is the plot of the magnitude frequency response of the combined signal and (b) is the plot of the magnitude frequency response of the filtered signal.
!P.Multi = [0, 1, 2]
t = FINDGEN(1024)
; Generate three bandpass signals.
s1 = SIN(0.6*t)
s2 = SIN(1.2*t)
s3 = SIN(1.9*t)
; Combine the three signals.
x = s1 + s2 + s3
; Generate abscissa values for the normalized frequency.
f = FINDGEN(512)/511
; Plot the magnitude frequency response of the combined signal.
PLOT, f, (ABS(FFTCOMP(x, /Complex)))(0:512), $
Title = 'Original', XStyle = 1
; Approximate a bandpass filter to isolate the first signal.
h = FIRDESIGN(101, 0.1, 0.3, /Bandpass)
; Apply the filter to the signal.
y = FIRFILT(h, x)
; Plot magnitude frequency response of the filtered signal.
PLOT, f, (ABS(FFTCOMP(y,/Complex)))(0:512), $
Title = 'Filtered', XStyle = 1
See Also
For Additional Information
Oppenheim and Schafer, 1989.
Proakis and Manolakis, 1992.
Version 2017.0
Copyright © 2017, Rogue Wave Software, Inc. All Rights Reserved.