FREQTRANSDESIGN Function (PV-WAVE Extreme Advantage)
Creates the numerator polynomial of a stable all-pass filter. The resulting filter is used to perform a frequency transformation of a lowpass prototype filter into a multiple bandpass filter.
Usage
result = FREQTRANSDESIGN(phi)
Input Parameters
phi— An array of normalized cutoff frequencies (between 0 and 1).
Returned Value
result—An array of polynomial coefficients.
Keywords
Lowstop—If present and nonzero, the transformation creates a lowstop filter. The filter passed into FREQTRANS must be a highpass filter.
Discussion
The transformation generated by FREQTRANSDESIGN must be applied to a lowpass filter with a cutoff frequency of 0.5 (normalized) or the transformation won’t work correctly.
The result polynomial is passed to FREQTRANS along with a lowpass digital filter to create a multiple bandpass filter.
The algorithm used in FREQTRANSDESIGN comes from Franchitti, 1985.
note | Using this function to generate polynomials of order 13 or greater is not advised. |
Example
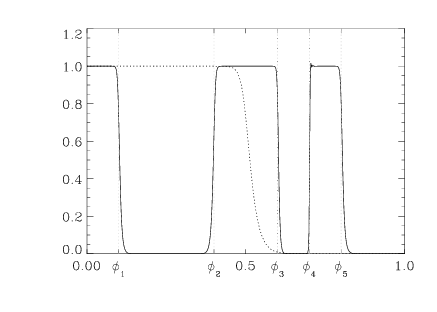
This example creates a lowpass filter and then transforms that into a multiple bandpass filter. The results are shown in
Figure 2-16: FREQTRANSDESIGN Example on page 95, which shows a plot of the original lowpass Butterworth filter and the transformed multiple bandpass filter. Reference lines indicate the cutoff frequencies used in the FREQTRANSDESIGN multiple bandpass example.
; Defines an order-15 Butterworth filter with normalized cutoff
; frequency of 0.5.
h = IIRDESIGN(15, 0.5, /Butter)
; Defines the new cutoff frequencies.
phi = [0.1, 0.4, 0.6, 0.7, 0.8]
; Set up some plotting parameters.
!X.Ticks = 7
!X.Style = 1
!P.Charsize = 1.5
!Y.Range = [0,1.2]
!X.Tickv = [phi(0), phi(1), 0.5, phi(2), phi(3), phi(4), 1.0]
; Construct the frequency transformation polynomial.
p = FREQTRANSDESIGN(phi)
; Transform filter and compute frequency response in one step.
result = ABS(FREQRESP_Z(FREQTRANS(h, p), Outfreq = f))
ticks = ['!4u!6!l1', '!4u!6!l2', '0.5', '!4u!6!l3', '!4u!6!l4', $
'!4u!6!l5', '1.0']
!X.Tickname = ticks
; Plot the frequency response of the transformed filter.
PLOT, f, result, Thick = 2
; Plot the response of the original filter.
OPLOT, f, ABS(FREQRESP_Z(h)), Thick = 2, Linestyle = 1
; Plot some lines at the cutoff frequencies.
REFLINES, phi
See Also
For Additional Information
Franchitti, 1985.
Roberts and Mullis, 1987, pp. 202–207.
Version 2017.0
Copyright © 2017, Rogue Wave Software, Inc. All Rights Reserved.