OPLOTCOMB Procedure (PV-WAVE Extreme Advantage)
Produces a comb plot over a previously drawn plot.
Usage
OPLOTCOMB, signal
OPLOTCOMB, abscissa, signal
Input Parameters
abscissa—A one-dimensional array containing the abscissa of the signal to be plotted.
signal—A one-dimensional array containing the signal to be plotted.
Keywords
Color—Specifies the index of the plot color to use for the comb plot.
Discussion
OPLOTCOMB uses OPLOT to produce a comb plot over a previously drawn plot.
Example
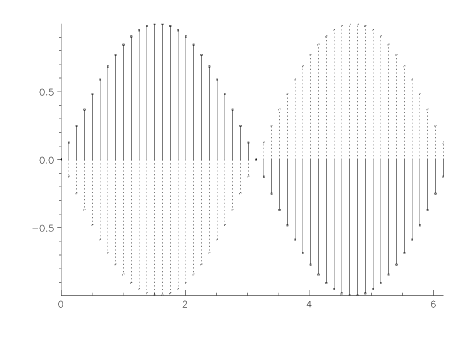
In this example, OPLOTCOMB is used to overlay a plot on a plot previously drawn using PLOTCOMB. The results are shown in
Figure 3-11: OPLOTCOMB Procedure Example on page 151.
n = 50
t = 2*!Pi*(FINDGEN(n)/n)
; Plot one full period of a sine wave, using PLOTCOMB.
PLOTCOMB, t, SIN(t)
; Change line style to dotted.
!P.Linestyle = 1
; Multiply the sine wave by (–1) and plot with dotted lines
; using the OPLOTCOMB procedure.
OPLOTCOMB, t, -SIN(t)
See Also
In the PV‑WAVE Reference:
OPLOT, PLOT
Version 2017.0
Copyright © 2017, Rogue Wave Software, Inc. All Rights Reserved.