PLOTCOMB Procedure (PV-WAVE Extreme Advantage)
Creates a comb plot of an input signal.
Usage
PLOTCOMB, signal
PLOTCOMB, abscissa, signal
Input Parameters
abscissa—A one-dimensional array containing the abscissa of the signal to be plotted.
signal—A one-dimensional array containing the signal to be plotted.
Keywords
Color—Specifies the index of the plot color to use for the comb plot.
Title—A string containing the title above the plot.
Xrange—Two-element array containing desired data range for the x-axis.
Xtitle—A string containing the title of the x-axis.
Yrange—Two-element array containing desired data range for the y-axis.
Ytitle—A string containing the title of the y-axis.
Discussion
PLOTCOMB uses PLOT and OPLOT to produce a comb plot. Keywords can be used to add a plot title, axis titles, and to specify the range of the axis to be plotted.
Example
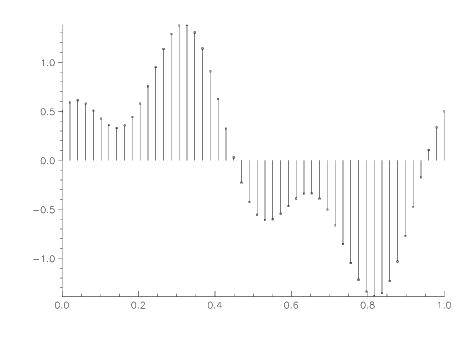
In this example, a comb plot is created for a combined sinusoidal signal.
t = FINDGEN(50)/49
; Generate the comb plot of the signal.
PLOTCOMB, t, SIN(2*!Pi*t) + .5*COS(6*!Pi*t)
See Also
In the PV‑WAVE Reference:
OPLOT, PLOT
Version 2017.0
Copyright © 2017, Rogue Wave Software, Inc. All Rights Reserved.