Visualization Toolkit
note | PV-WAVE is now also linked to the updated Visualization Toolkit (7.1.0) and is available on Windows and Linux platforms. Use the
VTK7 OPI routines to take advantage of the improved 3D visualizations. |
PV‑WAVE users can create high quality, interactive graphics through the use of the PV‑WAVE link to the Visualization Toolkit (VTK). The Visualization Toolkit is an Open Source toolkit for creating both simple and complex visualizations in 3D using OpenGL, a low-level software interface to graphics hardware, for high-performance, accelerated graphics. In addition to convenience routines that have been written to access some of the more common VTK utilities, all of the functionality available in the Visualization Toolkit is available to PV‑WAVE users. The two products complement each other well. PV‑WAVE excels at data access, data manipulation, numerical algorithms, data filtering, user interface development, and many interactive 2D graphical tasks. The Visualization Toolkit is a best-of-breed tool for creating complex 3D visualizations. Together they provide a simple and quick way to build tools for Visual Data Analysis.
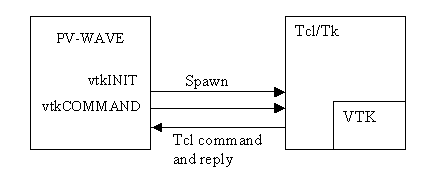
The VTK toolkit was integrated into PV‑WAVE using a Tcl shell as an intermediary. Tcl is a popular scripting language, see
www.tcl.tk for more information. The VTK toolkit already has a binding for the Tcl language. PV‑WAVE spawns a Tcl shell and communicates with it using sockets, sending VTK commands formatted for Tcl.
Creating the Tcl Shell shows how the two routines
vtkINIT and
vtkCOMMAND are used to create the Tcl shell and send commands to it, including VTK commands:
The vtkCOMMAND procedure is used in PV‑WAVE to send individual commands to the shell, and higher level wrappers have been built around this to allow many common PV‑WAVE plotting commands to be accessed in a manner similar to existing PV‑WAVE commands. Some of these commands include vtkWINDOW, vtkLIGHT, vtkPLOTS, vtkSURFACE, and vtkPOLYSHADE. The full power of the VTK visualization pipeline can still be accessed but requires specific knowledge of the VTK objects and methods.
A set of commands for packaging data into one of five supported data types in VTK is also provided, allowing data to be easily sent from PV‑WAVE to VTK.
Many procedures have a Name keyword which allows you to either choose a name for the object you are creating or return a generated one. This acts as a bridge between the high-level PV‑WAVE wrappers and low-level VTK functionality. Thus you can create a vtkSURFACE object and later use low-level VTK commands to change specific properties of this object.
Currently the VTK windows cannot be integrated into a user interface created with PV‑WAVE widgets. However, widgets can be used to size, position and annotate an object in a VTK window by passing keywords from the widget to the vtkWINDOW.
note | The PV‑WAVE link to the Visualization Toolkit is available on Windows and most UNIX platforms. |
Demonstration Programs
You can run the demonstration programs and look at the code in:
(UNIX) <RW_DIR>/vtk-3_2/demo
(WIN) <RW_DIR>\vtk-3_2\demo
Where <RW_DIR> is the main Rogue Wave directory.
These routines can be modified to work with your own data.
You can download the Visualization Toolkit and reference documentation from
public.kitware.com.
Version 2017.1
Copyright © 2019, Rogue Wave Software, Inc. All Rights Reserved.