ERRPLOT Procedure
Standard Library procedure that overplots error bars over a previously-drawn plot.
Usage
ERRPLOT[, points], low, high
Input Parameters
points—(optional) A vector containing the independent or abscissae values of the function. If points is omitted, the abscissae values are taken to be unit distances along the x-axis, beginning with 0.
low—A vector containing the lower bounds of the error bars. The value of low(i) is equal to the data value at i minus the lower error bound.
high—A vector containing the upper bounds of the error bars. The value of high(i) is equal to the data value at i plus the upper error bound.
Keywords
Width—The width of the error bars. If omitted, the width is set to one percent of the plot width.
Discussion
Error bars are drawn for each element, extending from low to high.
Example
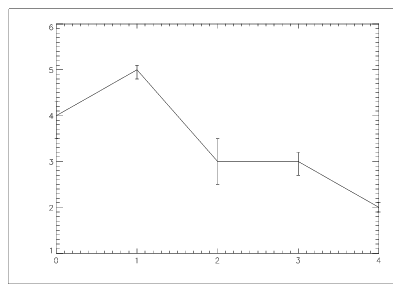
Assume the vector y contains the data values to be plotted, and that err is the symmetrical error estimate. The commands to plot the data and overplot the error bars are:
y = [4.0, 5.0, 3.0, 3.0, 2.0]
err = 0.2
PLOT, y, YRange=[1, 6]
ERRPLOT, y-err, y+err
If the error estimates are asymmetrical, they should be placed in the vectors low and high. For example:
low = [3.5, 4.8, 2.5, 2.7, 1.9]
high = [4.3, 5.1, 3.5, 3.2, 2.1]
PLOT, y, YRange=[1, 6]
ERRPLOT, low, high
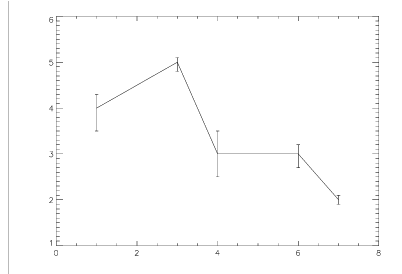
To plot error bars versus a vector containing specific points along the X axis, use the following commands:
points = [1.0, 3.0, 4.0, 6.0, 7.0]
PLOT, points, y, YRange=[1, 6]
ERRPLOT, points, low, high
See Also
Version 2017.1
Copyright © 2019, Rogue Wave Software, Inc. All Rights Reserved.