Psym Keyword
Used With Routines:
OPLOT,
PLOT,
PLOTS,
POLYFILL Corresponding System Variable:
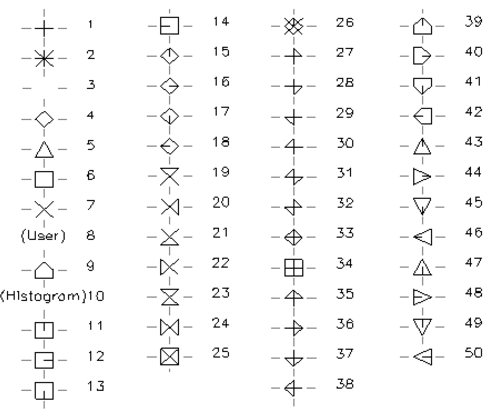
!P.Psym Specifies by reference number a symbol used to mark each data point. The available symbols and their corresponding reference numbers are shown in
Plot Symbols with Reference Numbers.
Normally,
Psym is 0, data points are connected by lines, and no symbols are drawn to mark the points. Set !P.Psym to the symbol index as given in
Plot Symbols with Reference Numbers to mark points with symbols. The keyword
Symsize is used to set the size of the symbols.
Negative values of Psym cause the symbol designated by |Psym| to be plotted at each point with solid lines connecting the symbols. For example, a Psym value of –5 plots triangles at each data point and connects the points with lines.
The USERSYM procedure creates a user-defined symbol (number 8).
For symbol number 10, Histogram, data points are plotted in the histogram mode. Horizontal and vertical lines are connect the plotted points, as opposed to the normal method of connecting points with straight lines.
When used with PLOT, OPLOT, and PLOTS, the Psym keyword can specify an array of plot symbols. If an array is used, each plot symbol value in the array is applied, in order, to create the plot symbols that make up the graph. The symbols are repeated, as needed, to complete the entire graph of the data set.
note | You cannot specify an array of values for the !P.Psym system variable. The array of color values can only be used with the Psym keyword. |
Example
The following code plots an array using points, and then overplots the smoothed array, connecting the points with lines:
; Plot using points.
A = RANDOMU(s, 15)
PLOT, A, Psym=4
; Overplot smoothed data.
OPLOT, SMOOTH(A, 11)
Version 2017.1
Copyright © 2019, Rogue Wave Software, Inc. All Rights Reserved.