Using the Display Component
The display component is the workhorse class of the chart system. The display graphs the data according to the selected graph type and axis style. This generally involves drawing appropriately scaled axes with labels, tick marks, and grid lines.
In our discussion of the display component, the focus is on selecting a chart and axis type and configuring the axes as desired. Methods for modifying the appearance of the various lines, wigets, bars, and pie wedges that represent the data items are described in later sections of this chapter.
Techniques for creating your own custom chart types or for changing the standard Objective Chart behavior by subclassing are discussed in Chapter 16, “Chart Extensions.”
SRGDisplayBase
SRGDisplayBase is an abstract base class for display components, particularly SRGraphDisplay. Currently, SRGraphDisplay handles all chart types. By isolating common functionality in a base class, additional display classes (based on SRGDisplayBase) that are specialized for a particular chart type, may be implemented.
SRGDisplayBase defines the basic functionality common to all graph types. It implements several routines related to axis scaling. Most importantly, SRGDisplayBase overrides SRGraphComponent::DrawForeground() to oversee the complex drawing process.
DrawForeground() breaks the drawing process into four basic steps:
1. Prepare()— determines axis limits (autoscaled or fixed).
2. DrawLabels()— generates and displays axis labels (interaction between the axis labels and the data display rectangle generally requires a two-pass process).
3. DrawAxis()— draws a frame around the data display rectangle with tick marks and grid lines.
4. DrawData()— displays the data items.
NOTE >> Steps 3 and 4 may be interchanged depending on the grid order chosen in the style member — see SRGraphStyle::SetGridOrder().
SRGDisplayBase implements these general functions which call specialized helper functions (defined in SRGraphDisplay) appropriate for the selected graph and axis types.
Because SRGDisplayBase is an abstract class, it can not be instantiated. Its functions are usually accessed through a derived class — SRGraphDisplay or a graph-type specific class.
SRGraphDisplay
SRGraphDisplay builds on SRGDisplayBase to implement the specialized routines for processing and painting the various chart and axis types. SRGraphDisplay contains the PrepareXXX(), DrawXXXLabels(), DrawXXXAxis(), and DrawXXXData() routines for all the standard chart-type families. SRGraphDisplay is the class most often instantiated and configured. Also, it is the class that is usually subclassed to create custom charts.
Graph-Type Specific Displays
The functionality of SRGraphDisplay has been divided into a set of smaller display classes, also derived from SRGDisplayBase, that are specialized to draw a particular graph type or a set of related graph types. For example, SRGPieGraph can only draw pie charts and SRGScatterGraph can only handle the various XY scatter graphs. They only support the axis types that are compatible with the chosen graph type.
If your application requires a specific graph type, using one of these “discrete” classes instead of SRGraphDisplay can produce a smaller executable file. In addition, you may find these classes easier to study or to customize.
For many graph types, an intermediate layer of abstract base classes resides between SRGDisplayBase and the graph-specific display class. Each of these intermediate base classes provides axis drawing functions for several graph-specific classes with common axis requirements.
The files containing these classes are stored in the Discrete subdirectories of the source (Src) and Include directories. The libraries and your application must be built to include these classes by defining the symbol _OC_DISCRETE and a chart-type specific symbol (see ochart.h) in the compiler’s preprocessor definitions. The new Build Wizard lets you select a specific chart type. It defines these symbols in an include file and builds the special library. Your application is automatically linked with the special library.
The size of the executable file can be further reduced by defining _OC_DONT_SUPPORT_TEXT_TEMPLATE, which eliminates support for text templates and the class dependencies that it involves.
The definition of _OC_DISCRETE also:
• Disables support for compound components, minimizing the memory requirements for applications using these new display classes.
• Disables support for the Chart Wizard because the chart and axes types can not be freely changed.
NOTE >> The Chart Wizard allows the user to select from all the graph and axis types. It also allows the user to add a new SRGraphDisplay component. When _OC_DISCRETE is defined, SRGraphDisplay is not defined in the library and some graph types are undefined.
Data Display Rectangle
The display component maintains a rectangle that is used to size and position the chart’s data display area. The m_DisplayRect member normally starts out the same size as the component panel, m_Rect. It is reduced in size to accommodate the labels on the chart axes and parts of the axis frame. The final data display rectangle is used to scale and position the chart data items on screen. This adjustment of the display rectangle makes preparing and drawing the graph labels a two-step process.
It is possible to directly program a rectangle into the m_DisplayRect member and lock it so that the display area remains fixed in place. This is useful for aligning multiple chart displays. For more details, see the SRGraphStyle::DRLock() function in the Class Reference and Chapter 24, “Chart Combinations.”
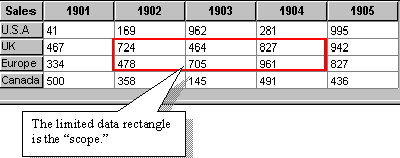
Display Scope
The rectangular subset of the data array from which the display takes its numeric information is known as the display scope. All data objects created but outside the selected scope are ignored by the display. Actually, all Objective Chart components have a defined scope, but the display component makes the most use of it.
Figure 105 shows the rectangular area of a grid that would be accessible by a display component with a limited scope.
To set the scope of your display or other component use:
• SRGraphComponent::SetMinGroup() and
• SRGraphComponent::SetMaxGroup() functions for the groups and
• SRGraphComponent::SetMinIndex() and
• SRGraphComponent::SetMaxIndex() for the indices.
Alternatively, use SRGraphComponent::SetScope(nImin, nImax, nGmin, nGmax) to set all the limits at once.
The component list may contain several displays with different or overlapping scopes. Scope limits may be set to a value of –1. Any scope limit with this value automatically defaults to the maximum or minimum available data position in the array.
For example, pDisplay->SetScope(–1, -1,4,4) includes all the indices of group 4 and pDisplay->SetScope(2,3,5,-1) includes only the data in indices 2 and 3 that have a group number greater than or equal to 5.
If a data scope is not explicitly selected for a component, SetScope(‑1,‑1,‑1,‑1) is assumed, making all the data objects available.
NOTE >> Index and group numbers are zero-based.
Selecting a Graph Type
Your most important choice about your chart is the type of graph that is used to represent your data. Chapter 6, “Chart Types,” described the various graph and axis types supported by Objective Chart. The Wizard Demo sample application can help you or your end-user select the chart type that is most appropriate for the data.
Chart styles may be chosen by setting two main styles in the m_Style member of the display component. These styles are the graph type using the CX_GRAPH_XXXXX styles and the axis type using the CX_AXIS_XXXXX styles. These styles may be set using the SRGraphStyle::SetGraphStyle() and SRGraphStyle::SetAxisStyle() functions.
For example, the following code segment creates a display component that displays a pie chart that covers the entire screen.
SRGraphDisplay *pD=new SRGraphDisplay;
pD->GetStyle()->SetGraphStyle(CX_GRAPH_PIE);
pD->GetStyle()->SetAxisStyle(CX_AXIS_AUTOMATIC);
pD->SetMeasurement(SRGraphComponent::PERCENT);
pD->SetRect(-1,-1,-1,-1);
m_Graph.AddComponent(pD);
The tables below list the standard graph and axis styles in Objective Chart. The third table shows which axis types are supported for the various graph types.
Table 7 – List of Graph Styles
Graph Style | Description |
CX_GRAPH_NONE | No style defined |
CX_GRAPH_LINE | Simple line plot with wigets |
CX_GRAPH_LINEONLY | Line only (no wigets) |
CX_GRAPH_AREA | Area under a curve |
CX_GRAPH_STEP | Step chart |
CX_GRAPH_STEPLO | Step chart — line only |
CX_GRAPH_VBAR | Simple vertical bar chart |
CX_GRAPH_HBAR | Simple horizontal bar chart |
CX_GRAPH_STACK_VBAR | 2D stacked vertical bars (not summed) |
CX_GRAPH_STACK_HBAR | 2D stacked horizontal bars (not summed) |
CX_GRAPH_EX_VBAR | Extended VBar (Pseudo 3D) |
CX_GRAPH_EX_HBAR | Extended HBar (pseudo 3D horizontal bars) |
CX_GRAPH_STRATA | Strata graph (summed) |
CX_GRAPH_STRATAVBAR | Strata vertical bar (one index per bar) |
CX_GRAPH_STRATAHBAR | Strata horizontal bar (one index per bar) |
CX_GRAPH_STRATAVBARG | Strata vertical bar (one group per bar) |
CX_GRAPH_STRATAHBARG | Strata horizontal bar (one group per bar) |
CX_GRAPH_STOCK | Highs, lows, and now (or close) |
CX_GRAPH_AREASTOCK | Area style stock quote (hi-low) |
CX_GRAPH_CANDLE | Candle chart style |
CX_GRAPH_HILO_OPENCLOSE | Hi-Low Open Close chart |
CX_GRAPH_FREESTYLE | Classic graph with free style objects |
CX_GRAPH_PIE | Pie chart |
CX_GRAPH_ISO_PIE | 3D pie chart |
CX_GRAPH_ISO_BAR | 3D Manhattan graph |
CX_GRAPH_ISO_AREA | 3D Rooftop graph |
CX_GRAPH_RIBBON | Ribbon graphs are rooftop graphs without sides or ends. |
CX_GRAPH_XYSCATTERA | Scatter plot using alternate X and Y values |
CX_GRAPH_XYSCATTERG | Scatter plot: even groups = Xs and odd groups = Ys |
CX_GRAPH_XYSCATTERI | Scatter plot: even indices = Xs and odd indices = Ys |
CX_GRAPH_XYSCATTERA_EX | Scatter charts with log/linear axis differentiation |
CX_GRAPH_XYSCATTERG_EX | Scatter charts with log/linear axis differentiation |
CX_GRAPH_XYSCATTERI_EX | Scatter charts with log/linear axis differentiation |
CX_GRAPH_BUBBLE_R | Bubble chart, radius proportional to size variable |
CX_GRAPH_BUBBLE_A | Bubble chart, area proportional to size variable |
CX_GRAPH_VECTOR_E | Vector chart, angle+magnitude, tail at x-y position |
CX_GRAPH_VECTOR_C | Vector chart, angle+magnitude, midpoint at x-y position |
CX_GRAPH_VECTOR_G | Vector chart, two end points |
CX_GRAPH_GANTT | Gantt chart |
CX_GRAPH_POLAR | Polar chart with phase and magnitude |
CX_GRAPH_AREAPOLAR | Polar chart with filled areas |
CX_GRAPH_WEB | Web charts are polar or radar graphs |
CX_GRAPH_AREAWEB | Web chart with filled areas |
CX_GRAPH_HISTOGRAM | Histogram or frequency spectrum |
CX_GRAPH_OSCILLISCOPE | Dynamic multiple plots1 |
CX_GRAPH_TIMESPAN | Horizontal time-span bars1 |
CX_GRAPH_USER | User styles are in the range 00c00000 to 00ff0000; all other values are .reserved |
Selecting an Axis Type
An axis style is selected by calling SRGraphStyle::SetAxisStyle(). If the default axis style, CX_AXIS_AUTOMATIC, is selected, Objective Chart chooses an axis type appropriate for the specified graph type. This combination is satisfactory in most cases.
Table 8 – List of Axis Styles
Axis style | Description |
CX_AXIS_NONE | No style defined |
CX_AXIS_AUTOMATIC | Style chosen according to graph type |
CX_AXIS_CLASSIC | Automatic — data values plotted vertically |
CX_AXIS_CLASSIC_RIGHT | Classic axis with labels on the right |
CX_AXIS_ISO_CLASSIC | Classic axis but with pseudo 3D effect |
CX_AXIS_ISO_CLASSIC_R | Classic axis, pseudo 3D, labels on the right |
CX_AXIS_DATE | Classic axis with date scale |
CX_AXIS_DATE_R | Classic axis with date scale on the right |
CX_AXIS_ISO_DATE | Pseudo 3D classic axis with date scale |
CX_AXIS_ISO_DATE_R | Pseudo 3D classic axis with date scale on the right |
CX_AXIS_YX | Classic axis, but with data values plotted horizontally |
CX_AXIS_ISO_CLASSIC_YX | Classic pseudo 3d for horizontal graphs |
CX_AXIS_DATE_YX | Classic axis with date scale on the horizontal axis |
CX_AXIS_ISO_DATE_YX | Pseudo 3D classic axis with date scale on a horizontal axis |
CX_AXIS_PIE | Pie chart labeling |
CX_AXIS_STAGE_SW | 3/4 stage from southwest |
CX_AXIS_STAGE_SE | 3/4 stage views from southeast |
CX_AXIS_PLATFORM_SW | Viewed from southwest |
CX_AXIS_PLATFORM_SE | Platform — stage with no back or sides viewed from southeast |
CX_AXIS_XYSCATTER | Scatter graph axis |
CX_AXIS_SCATTER_DATEX | Scatter axis with a date scale on the X axis |
CX_AXIS_SCATTER_DATEY | Scatter axis with a date scale on the Y axis |
CX_AXIS_GANTT_VALUE | Gantt chart axis, value scale |
CX_AXIS_GANTT_DATE | Gantt chart axis, date scale |
CX_AXIS_POLAR | Polar chart axes |
CX_AXIS_WEB | Web chart axis |
CX_AXIS_OSCILLISCOPE+ | +-X, +-Y for 2D plots |
CX_AXIS_H_FRAME+ | “Rugby” (American football) goal posts1 |
CX_AXIS_USER | User styles are in the range c0000000 to ff000000; all other values are reserved. |
Valid Graph and Axis Combinations
In the table below, all the axis types on the right can be used with the graph types listed on the left. Of course, CX_AXIS_NONE and CX_AXIS_AUTOMATIC can be used with any graph type.
Table 9 – List of valid graph and axis combinations
Graph Types | Valid Axis Types |
CX_GRAPH_LINE
CX_GRAPH_LINEONLY
CX_GRAPH_STEP
CX_GRAPH_STEPLO
CX_GRAPH_AREA
CX_GRAPH_STRATA
CX_GRAPH_FREESTYLE
CX_GRAPH_STOCK
CX_GRAPH_AREASTOCK
CX_GRAPH_CANDLE
CX_GRAPH_HILO_OPENCLOSE | CX_AXIS_CLASSIC
CX_AXIS_CLASSIC_RIGHT
CX_AXIS_DATE
CX_AXIS_DATE_R |
CX_GRAPH_VBAR
CX_GRAPH_STACK_VBAR
CX_GRAPH_STRATAVBAR
CX_GRAPH_STRATAVBARG | CX_AXIS_CLASSIC1
CX_AXIS_CLASSIC_RIGHT
CX_AXIS_DATE
CX_AXIS_DATE_R
CX_AXIS_ISO_CLASSIC
CX_AXIS_ISO_CLASSIC_R
CX_AXIS_ISO_DATE
CX_AXIS_ISO_DATE_R |
CX_GRAPH_EX_VBAR | CX_AXIS_ISO_CLASSIC1
CX_AXIS_ISO_CLASSIC_R
CX_AXIS_ISO_DATE
CX_AXIS_ISO_DATE_R |
CX_GRAPH_HBAR
CX_GRAPH_STACK_HBAR
CX_GRAPH_STRATAHBAR
CX_GRAPH_STRATAHBARG | CX_AXIS_YX1
CX_AXIS_DATE_YX
CX_AXIS_ISO_CLASSIC_YX
CX_AXIS_ISO_DATE_YX |
CX_GRAPH_EX_HBAR | CX_AXIS_ISO_CLASSIC_YX1
CX_AXIS_ISO_DATE_YX |
CX_GRAPH_XYSCATTERA
CX_GRAPH_XYSCATTERI
CX_GRAPH_XYSCATTERG
CX_GRAPH_XYSCATTERA_EX
CX_GRAPH_XYSCATTERI_EX
CX_GRAPH_XYSCATTERG_EX
CX_GRAPH_BUBBLE_R
CX_GRAPH_BUBBLE_A
CX_GRAPH_VECTOR_E
CX_GRAPH_VECTOR_C
CX_GRAPH_VECTOR_G | CX_AXIS_XYSCATTER1
CX_AXIS_SCATTER_DATEX
CX_AXIS_SCATTER_DATEY |
CX_GRAPH_PIECX_GRAPH_ISO_PIE | CX_AXIS_PIE1 |
CX_GRAPH_ISO_BAR
CX_GRAPH_ISO_AREACX_GRAPH_RIBBON | CX_AXIS_STAGE_SW1
CX_AXIS_STAGE_SE
CX_AXIS_PLATFORM_SW CX_AXIS_PLATFORM_SE |
CX_GRAPH_WEB
CX_GRAPH_AREAWEB | CX_AXIS_WEB1 |
CX_GRAPH_POLAR
CX_GRAPH_AREAPOLAR | CX_AXIS_POLAR1 |
CX_GRAPH_GANTT | CX_AXIS_GANTT_VALUE1
CX_AXIS_GANTT_DATE |
CX_GRAPH_HISTOGRAM+ve
CX_GRAPH_OSCILLOSCOPE+
CX_GRAPH_TIMESPAN+ | CX_AXIS_HISTOGRAM
CX_AXIS_OSCILLOSCOPE2
CX_AXIS_DATE_YX |
Changing Chart Types Dynamically
The graph and axis styles are usually specified when the chart is first set up — in OnNewDocument() or OnInitialUpdate(). In your application, you may allow the end user to select a different style by clicking a menu command or dialog button after the chart is displayed.
The code segment below is a command handler that changes the graph type to CX_GRAPH_VBAR. Note the use of SRGraph::GetComponent() to find the first display in the component list. Setting the style is different flag is required when making major changes that require a different type of axis scale.
To dynamically change the chart type, axis style, or log/linear scale after the chart is initially drawn, call SetStyleIsDifferent(TRUE) to ensure that the axis labels are updated.
void COCAppView::OnVBar()
{
SRGraphDisplay *pD=
(SRGraphDisplay *)GetDocument()-> m_Graph.GetComponent(0,IDS_SRG_DISPLAYTYPE);
if(pD!=NULL)
{
pD->GetStyle()-> SetGraphStyle(CX_GRAPH_VBAR);
pD->GetStyle()-> SetAxisStyle(CX_AXIS_AUTOMATIC);
pD->GetStyle()->SetStyleIsDifferent(TRUE);
Invalidate();
}
}
Defining the Chart Axes
The graph type and axis style are the only information that SRGraphDisplay requires in order to draw a graph. But, it has many style settings that control the details of how the graph is displayed. In particular, there are style flags to select between linear or logarithmic axis scaling, autoscaled or fixed axis limits, and to control the appearance of tick marks and grid lines.
Logarithmic Axis Scaling
By default, all axis scales are linear, but almost all the standard graph types support logarithmic scaling where appropriate. To select logarithmic scaling of the numeric axis, call SetLog(TRUE) for the style member of the display component.
SRGraphDisplay *pD=new SRGraphDisplay;
SRGraphStyle* pS=pD->GetStyle();
// Display needs to know type of chart to display
pS->SetGraphStyle(CX_GRAPH_LINE);
pS->SetAxisStyle(CX_AXIS_AUTOMATIC);
pS->SetLog(TRUE); // make it logarithmic
For the XY Scatter and related graphs that have two numeric axes, SetLog(TRUE) makes both axes logarithmic.
The Scatter graph styles that end with _EX (e.g., CX_GRAPH_XYSCATTERG_EX) support one linear axis and one logarithmic axis. For these graph types, SetLog() effects the vertical (Y) axis and SetLogX() effects the horizontal (X) axis.
Autoscaling Axis Limits
By default, the axis limits are automatically set to fit the data values. SRGraphDisplay::Prepare()— defined in SRGDisplayBase— determines the axis limits. The following steps strictly apply only to linear, autoscaled axes.
1. According to the data requirements of the selected graph type, a specialized PrepareXXX() function is called to scan the data values to be plotted.
2. AdjustScale() expands the data range slightly to keep the data items (lines, wigets, bars, etc.) from approaching the edge of the display area too closely. By default, the range is expanded by 10% — 5% on either side, except for date scales that are not expanded. The amount of this expansion is determined by the virtual functions GetXScaleAdjustment() and GetYScaleAdjustment(), which may be overridden if desired.
NOTE >> This adjustment will not cause an axis limit to change sign.
3. AdjustScale() adjusts the lower limit to the nearest round number. The number of significant digits in the rounding depends on the magnitude of the data range.
For logarithmic axes, the limits are expanded to include full decades unless the data range is small and within one decade. The limits of linear, autoscaled axes are expanded to include zero, by default.
To disable the expansion of axis limits to include zero, call SRGraphStyle::SetAlwaysShowZero(FALSE).
SRGraphDisplay *pD=new SRGraphDisplay;
pD->GetStyle()->SetAlwaysShowZero(FALSE);
You can put limits on the autoscaling process using the SetScaleLimit() flag. For example, the code below would keep the autoscaled limits within the range of 0 to 1000.
To place maximum limits on autoscaled ranges, call SRGraphStyle::SetScaleLimit(TRUE) and set the limits.
SRGraphDisplay *pD=new SRGraphDisplay;
pD->GetStyle()->SetScaleLimit(TRUE);
pD->SetMinRangeY(0.); // max range from 0 to 1000
pD->SetMaxRangeY(1000.);
You can also place minimum limits on the autoscaled range by combining SetScaleLimit() with SetUseMaxScale(). In the next example, a data range of, say, 15 to 93 would be expanded to 0 to 100.
To place minimum limits on autoscaled ranges, call SRGraphStyle::SetScaleLimit(TRUE) and SetUseMaxScale(TRUE) and set the limits.
SRGraphDisplay *pD=new SRGraphDisplay;
pD->GetStyle()->SetScaleLimit(TRUE);
pD->GetStyle()->SetUseMaxScale(TRUE);
pD->SetMinRangeY(0.); // min range from 0 to 100
pD->SetMaxRangeY(100.);
NOTE >> This can be useful if all data values can be zero (or some other value), because Objective Chart can not automatically select a default axis scale which would be appropriate for all situations.
Setting Fixed Axis Limits
The automatic scaling features of Objective Chart attempt to give the best possible scale for the given data range. If this automatic scaling is not needed or presents problems of style, it is possible to lock the scales to an absolute range.
The fixed limits are utilized as specified. They are not expanded by AdjustScale(). They are not rounded to the nearest nice number for display.
To set fixed axis limits, call SetUseMaxScale(TRUE), SetMinRangeY(), and SetMaxRangeY(). The code snippet below shows how to set the y-axis scale to show values from 400 to 900.
SRGraphDisplay* pD = new SRGraphDisplay;
SRGraphStyle* pS = pD->GetStyle();
pS->SetGraphStyle(CX_GRAPH_LINE);
pS->SetUseMaxScale(TRUE); // manual scaling
pD->SetMinRangeY(400.); // range from 400 to 900
pD->SetMaxRangeY(900.);
For XY Scatter and related graphs with two numeric axes, use SetMinRangeY() and SetMaxRangeY() for the vertical (Y) axis and SetMinRangeX() and SetMaxRangeX() for the horizontal (X) axis. If limits are set for only one axis, the other axis is autoscaled.
To match the axis limits to the data range, call SetUseMaxScale(TRUE) and set the min and max limits to the same value. The axis is autoscaled, but the data range is not expanded by AdjustScale(). This can be a useful side effect as the axis limits closely represent the data range.
Customizing Axis Labels
By default, each axis is displayed with appropriate axis labels with tick marks and grid lines at each label position.
SRGDisplayBase::DrawLabels() and the specialized SRGraphDisplay::DrawXXXLabels() functions manage the creation of axis labels. Generally, a two step process is used. During the first pass, a trial set of axis labels are created based on the axis limits, the font size, label orientation, and the space available. The data display rectangle is adjusted to allow space for this set of labels. During the second pass, a new set of labels is generated based on the adjusted size of the data display rectangle.
Internally, DrawXXXLabels() creates scale class objects (SRGDecimalScale, SRGLogScale, SRGIndexScale, etc.) appropriate for each axis and sets their properties. Then it calls CreateLabels() for those scale objects. CreateLabels() generates the appropriately spaced labels and stores their positions.
Later, DrawXXXAxis() uses the list of label positions to draw the tick marks and grid lines. Therefore, there is a one-to-one correspondence between tick marks and labels. Grid lines are also drawn using the same tick mark positions.
The standard functions generate labels that are satisfactory for most applications. Occasionally, application requirements necessitate changing the standard labels. Because the scale class objects are created and configured internally, your control over the spacing and appearance of the axis labels is limited. Most changes require deriving from
SRGraphDisplay and overriding
DrawXXXLabels(). This procedure is described in
Chapter 16, “Chart Extensions.” See also
Chapter 18, “Compound Component System.” The Compound Component System was developed to facilitate this type of chart customization without subclassing.
“Avoiding Overlapped Labels”,
“Controlling Tick Marks and Grid Lines”, and
“Displaying an Axis Title” describe the features of the axis system that can be easily controlled using style settings of the display component.
Avoiding Overlapped Labels
All the charts that use the classic axis styles get their horizontal axis labels from the annotations of the data objects (usually from the first group plotted). These labels may be relatively long. You have several options for avoiding overprinting of axis labels.
By default, the axis labels are oriented horizontally. When overlapping is detected, one of the labels is hidden, not displayed. Often this results in every other or every third label being displayed. If the labels are of irregular length, irregular label spacing may result. Tick marks and grid lines are displayed for the hidden labels.
To have X or Y axis labels displayed in a staggered format, instead of simply being removed, in case of overlap, call SRGraphStyle::SetTierXLabels(TRUE) or SetTierYLabels(TRUE).
SRGraphDisplay* pD=new SRGraphDisplay;
pD->GetStyle()->SetTierXLabels(TRUE);
Another method of keeping the labels of the horizontal axis from overlapping is to orient them perpendicular to the axis line. To orient x-axis labels perpendicular to the axis line, call SRGraphStyle::SetXLCompatibility(FALSE).
SRGraphDisplay* pD=new SRGraphDisplay;
pD->GetStyle()->SetXLCompatibility(FALSE);
It is possible to specify other orientation angles using the techniques described in
“Overriding DrawXXXLabels().” Controlling Tick Marks and Grid Lines
The appearance of axis labels, tick marks, and grid lines is controlled by the SRGraphStyle member of the SRGraphDisplay component.
To turn on or off the display of tick marks and grid lines, use the SRGraphStyle::SetShowXTicks() and SRGraphStyle::SetShowXGrid() and the equivalent Y or Z functions.
The code snippet below illustrates how to turn off the drawing of grid lines:
// create a display component
SRGraphDisplay* pD=new SRGraphDisplay;
SRGraphStyle* pS=pD->GetStyle();
// set the graph and axis types
pS->SetGraphStyle(CX_GRAPH_XYSCATTERG_EX);
pS->SetAxisStyle(CX_AXIS_AUTOMATIC);
// disable horiz. and vertical grid lines
pS->SetShowXGrid(FALSE);
pS->SetShowYGrid(FALSE);
m_Graph.AddComponent((SRGraphComponent *)pD);
Grid line color is set by SRGraphStyle::SetGridColor().
SRGraphDisplay* pD=new SRGraphDisplay;
pD->GetStyle()->SetGridColor(CXCLR_GRAY20);
Normally, the grid is drawn first and the data items overwrite the grid. To display a grid on top of the data, call SRGraphStyle::SetGridOrder(FALSE).
SRGraphDisplay* pD=new SRGraphDisplay;
pD->GetStyle()->SetGridOrder(FALSE);
To change the length of tick marks, call SRGraphComponent::SetTickSize(). The units depend on the measurement mode — see SRGraphComponent::SetSizeDefaults() in the source code.
SRGraphDisplay* pD=new SRGraphDisplay;
pD->SetMeasurement(SRGraphComponent::PERCENT);
pD->SetRect(-1,10,-1,85);
pD->SetTickSize(1.5); // def=1.25 percent
To hide axis labels, tick marks, and gridlines, call SetShowIndices(0), SetShowGroups(0), or SetShowNumerals(0). As shown in Table 10, calling these functions turns off the generation of axis labels (and therefore tick marks and grid lines, too) for the indicated axis.
Table 10 – Functions for turning off axis labels
Function called | Axis hidden |
SetShowIndices(0) | Horizontal axis for classic styles
Vertical axis for YX styles
Horizontal axis for scatter graphs |
SetShowGroups(0) | Third axis for stage and platform styles
Horizontal axis for CX_GRAPH_STRATAVBARG
Vertical axis for CX_GRAPH_STRATAHBARG |
SetShowNumerals(0) | Vertical, numeric axis for classic styles
Horizontal axis for YX styles
Vertical axis for scatter graphs |
For example, the following code turns off all markings for the horizontal axis.
SRGraphDisplay* pD=new SRGraphDisplay;
SRGraphStyle* pS=pD->GetStyle();
pS->SetGraphStyle(CX_GRAPH_VBAR);
pS->SetAxisStyle(CX_AXIS_AUTOMATIC);
// disable drawing of horizontal axis
pS->SetShowIndices(FALSE);
Displaying an Axis Title
To set a vertical title for the Y-axis, for a standard display, you must create, position, and orient the label yourself. The following example uses the
SRGraphLabel class, as described in
“Using SRGraphLabel”.
// graph display rectangle is (5,5,95,80)
SRGraphLabel* pL=new SRGraphLabel;
// the label needs access to info about
// the chart’s window and country code
pL->SetParent(&m_Graph);
pL->SetAnnotation("Meters");
// position the label within the display area
pL->SetTextPosition( 7.,42.);
// using the percentage measurement mode
pL->SetMeasurement(SRGraphComponent::PERCENT);
// select a standard orientation -- vertical
pL->SetLabelStandard(SRGraphLabel::Upward);
// align bottom-center of label at text position
pL->SetLocationPoint(SRGraphLabel::BottomCenter);
// set the font size in pixels
pL->SetFontSize(-5);
// add the label to the component list
m_Graph.AddComponent((SRGraphComponent *)pL);
NOTE >> The compound display class makes customizing axis labels and titles much easier. It also allows greater flexibility in setting the appearance of tick marks and grid lines. See
Chapter 18, “Compound Component System.” Setting a Background Color for the Display Rectangle
Like other components, the background of a display component can be filled using the various SetComponentFillStyle() options. In addition, you can set the background color of the display rectangle (within the axis frame) by calling SetAxisFillStyle(TRUE). Using this option requires that the component fill style of the display be set to CX_NO_FILL. Therefore, a background component is generally needed to clear or fill the chart background. A typical use of this feature would look like this:
SRGraphComponent* pBkg =
m_Graph.AddComponent(IDS_SRG_BACKGROUNDTYPE);
SRGraphDisplay* pD = new SRGraphDisplay;
pD->GetStyle()->SetGraphStyle(CX_GRAPH_VBAR);
pD->GetStyle()->SetAxisStyle(CX_AXIS_AUTOMATIC);
pD->SetMeasurement(SRGraphComponent::PERCENT);
pD->SetRect(5,5,95,80);
pD->GetStyle()->SetComponentFillStyle(CX_NO_FILL);
pD->GetStyle()->SetAxisFillStyle(TRUE);
pD->GetStyle()->SetColor(CXCLR_GRAY10);
m_Graph.AddComponent(pD);