Step One: Creating and Displaying the Statistics Chart
NOTE >> Estimated time to complete Step 1: 60 minutes
Introduction
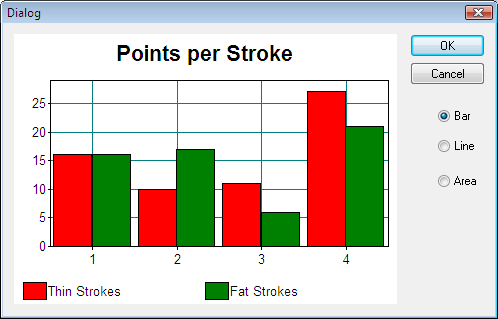
In this step of the sample, you will create a dialog box to display the Scribble statistics. The dialog will display bar, line, and area charts to compare the statistics on the number of points that make up the thin and fat "pen" strokes in the Scribble window.
Set Up the Resources
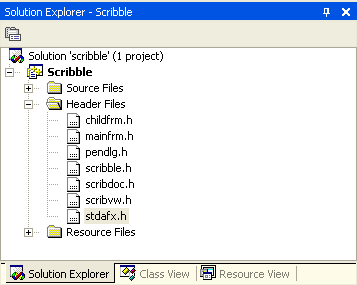
1. Open the Scribble solution (scribble<ver>.sln) from the step0 folder, where <ver> is the Micorsoft Visual Studio version.
2. Find and open the stdafx.h file for the project.
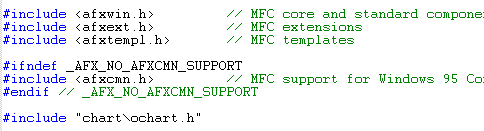
3. Include the Objective Chart header file so all of the files used in the Scribble project will know about Objective Chart. At the end of the stdafx.h file add the line:
#include "chart\ochart.h"
Your stdafx.h file should look like this:
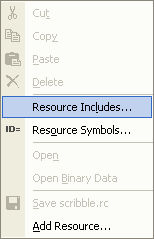
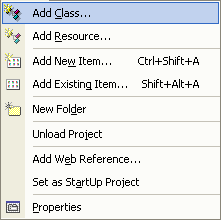
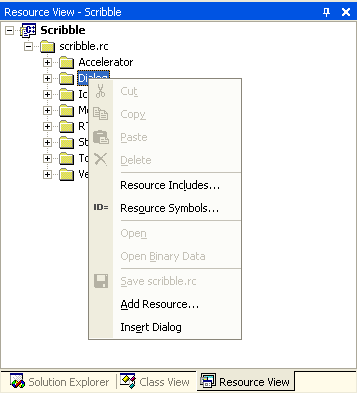
4. On the Resource View tab, right-click scribble.rc to bring up the menu shown in
Figure 33.
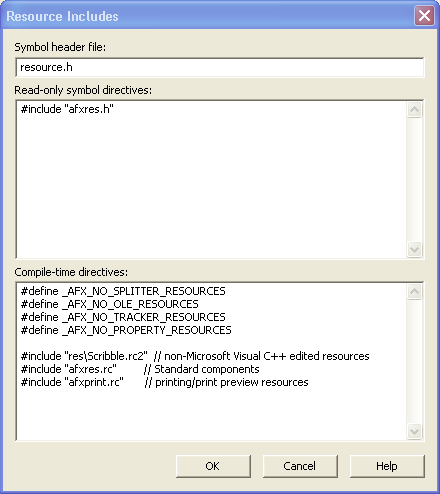
5. In the lower of the three edit boxes (Compile-time directives), add the following two lines to the end of the list.
#include "chart\SRGRes.rc"
#include "chart\WizRes.rc "// optional
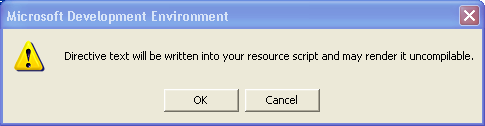
6. When you click OK you may see this message:
7. Click OK to continue.
The resources contained in the SRGRes.rc file must be added to the compile-time directives of your application. If the project is to support interactive editing of its charts by the Chart Wizard, the resources in WizRes.rc must also be included. Although the tutorial projects do not use the Chart Wizard, its resources are included here for instructional purposes.
The Objective Chart resources have been constructed so that their integer IDs are unlikely to collide with the IDs that are generated by most normal MFC-based projects. However, if you find that you do have resource ID warnings, we strongly advise you to rectify them by modifying your own resources, not by changing SRGRes.rc. If you do change this file, your work could be undone when you receive Objective Chart updates in the future.
Create CStatic-based Control for Use in a Dialog Box
When using Objective Chart to provide a control in a dialog box, it is convenient to create a wrapper class based on CStatic. An object of this class can be used as a member variable in your dialog box code, and ClassWizard can insert it for you automatically. Therefore, before creating the dialog, we will create a control class to display the chart. The chart can be initialized and modified via the member variable used to store the control in the dialog. You'll use ClassWizard to create a new MFC class named CGraphControl based on CStatic.
1. Choose Project |Add Class from the menu to invoke the Add Class dialog.
2. Click Add Class.
3. A dialog with icons for different types of classes will appear. Select the "MFC Class" Icon and click the OK button.
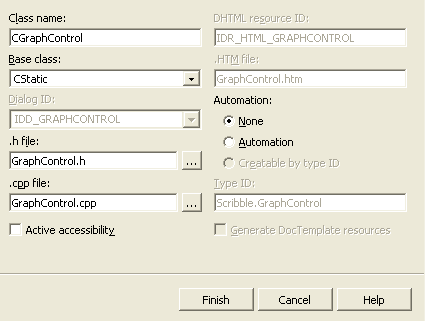
4. Type CGraphControl as the class name.
5. From the drop-down list, select CStatic as the Base class.
6. Click Finish.
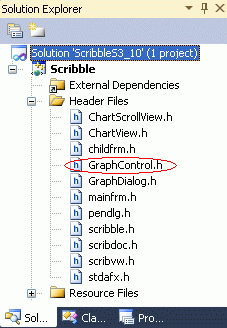
7. Open the header file GraphControl.h.
8. To define a new SRGraph member variable and several member functions, add the lines that are highlighted in blue text in the following code:
// CGraphControl window
class CGraphControl : public CStatic
{
// Construction
public:
CGraphControl();
// Attributes
public:
// Operations
public:
// Overrides
// ClassWizard generated virtual function overrides
//{{AFX_VIRTUAL(CGraphControl)
//}}AFX_VIRTUAL
// Implementation
public:
SRGraph m_Graph;
virtual void SetTitle(LPCSTR lpText);
virtual void SetIndexText(int nIndex,LPCSTR lpText);
virtual void SetHeaderText(int nGroup,LPCSTR lpText);
virtual void SetGraphData(int nIndex,int nGroup,double d);
virtual ~CGraphControl();
// Generated message map functions
protected:
//{{AFX_MSG(CGraphControl)
// NOTE - the ClassWizard will add and remove member
// functions here.
afx_msg void OnPaint();
afx_msg BOOL OnEraseBkgnd(CDC* pDC);
//}}AFX_MSG
CHART_DECLARE_MESSAGE_MAP()
};
///////////////////////////////////////////////////////////////////////////
//{{AFX_INSERT_LOCATION}}
// Microsoft Visual C++ will insert additional declarations
// immediately before the previous line.
#endif // !defined(AFX_GRAPHCONTROL_H__53D1342B_C640_48C8_82FA_07E040E1F1A4__INCLUDED_)
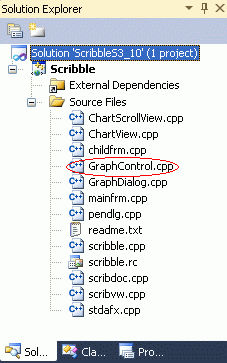
9. Locate the CGraphControl constructor (in GraphControl.cpp)...
and add code to create a chart with default settings. (See how to do this in the next step.)
10. At the end of the implementation file (GraphControl.cpp), add message handlers for the OnPaint() and OnEraseBkgnd() messages and the other member functions. Use the highlighted code from the following code segment.
// GraphControl.cpp : implementation file
//
#include "stdafx.h"
#include "Scribble.h"
#include "GraphControl.h"
#ifdef _DEBUG
#define new DEBUG_NEW
#undef THIS_FILE
static char THIS_FILE[] = __FILE__;
#endif
////////////////////////////////////////////////////////////
// CGraphControl
CGraphControl::CGraphControl()
{
// On initialization we can create a default chart
SRGraphTitle *pT=new SRGraphTitle;
pT->SetMeasurement(CX_PERCENT);
pT->SetRect(0,0,100,15);
pT->SetFontStyle(CX_FONT_BOLD | CX_FONT_AUTOSIZE);
m_Graph.AddComponent(pT);
SRGraphDisplay *pD=new SRGraphDisplay;
pD->SetMeasurement(CX_PERCENT);
pD->SetRect(0,15,100,90);
pD->GetStyle()->SetGraphStyle(CX_GRAPH_VBAR);
pD->GetStyle()->SetAxisStyle(CX_AXIS_CLASSIC);
m_Graph.AddComponent(pD);
SRGraphLegend *pL=new SRGraphLegend;
pL->SetMeasurement(CX_PERCENT);
pL->SetRect(0,90,100,100);
pL->SetKeySize(6);
pL->SetYMargin(0.0);
pL->GetStyle()->SetLegendKeyFirst(TRUE);
m_Graph.AddComponent(pL);
}
CGraphControl::~CGraphControl()
{
// SRGraph destroys itself.
}
BEGIN_MESSAGE_MAP(CGraphControl, CStatic)
//{{AFX_MSG_MAP(CGraphControl)
// NOTE - the ClassWizard will add and remove mapping
// macros here.
ON_WM_PAINT()
ON_WM_ERASEBKGND()
//}}AFX_MSG_MAP
END_MESSAGE_MAP()
//Objective Chart does not need the background to be erased,
//Not erasing the background will prevent flicker.
/////////////////////////////////////////////////////////////
// CGraphControl message handlers
void CGraphControl::OnPaint()
{
CPaintDC dc(this); // device context for painting
// The Objective Chart object takes over the paint process
// from here
m_Graph.DrawComponentList(&dc,this);
}
BOOL CGraphControl::OnEraseBkgnd(CDC* pDC)
{
return TRUE;
// Objective Chart does not need the background to be
// erased. Not erasing the background will prevent flicker.
}
void CGraphControl::SetGraphData(int nIndex, int nGroup, double d)
{
// The data is placed in the array
m_Graph.SetValue(nIndex,nGroup,d);
}
void CGraphControl::SetHeaderText(int nGroup, LPCSTR lpText)
{
// The group header is initialized with text
m_Graph.SetHeader(nGroup,lpText);
}
void CGraphControl::SetIndexText(int nIndex, LPCSTR lpText)
{
// The index header is initialised with text
m_Graph.GetGroup(0)->GetIndex(nIndex)->
SetAnnotation(lpText);
}
void CGraphControl::SetTitle(LPCSTR lpText)
{
// The title of the chart is initialized here
m_Graph.SetGraphTitle(lpText);
}
This completes the implementation of the CGraphControl class, which will be used to display our chart within a dialog.
NOTE >> You can copy the files for the CGraphControl class to your other projects and use it whenever you want to display a chart in a dialog, form view, or property page. Objective Chart includes enhanced versions of this control (SREGraphView and SREScrollView) that support user interaction (zooming, chart tips, data dragging, and printing) with the chart. Use these embedded view classes when you want any of these features. These classes are described in the Class Reference as well as in
“View Classes”, and are demonstrated in the DlgViews sample.
Construct a Dialog to Display the OC Control
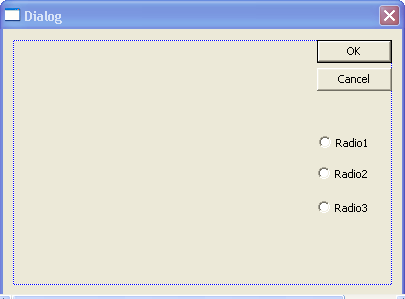
1. Select the Resource View tab, open the Scribble resources folder, and right-click the Dialog folder.
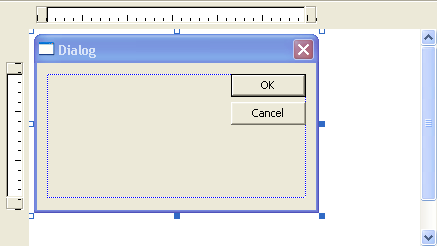
2. Choose Insert Dialog from the shortcut menu.
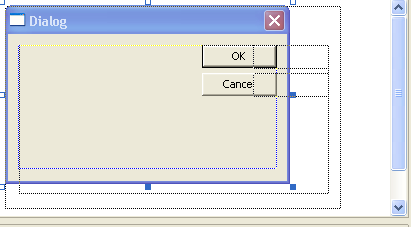
3. Resize the newly created dialog box (IDD_DIALOG1).
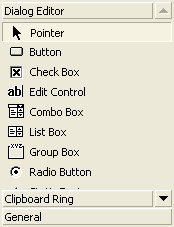
4. Use the
Controls toolbar palette (
Figure 43) to add three radio controls and a picture frame.
5. Arrange the controls on the dialog box, using commands from the Layout menu. The picture frame will define the position for the chart control.
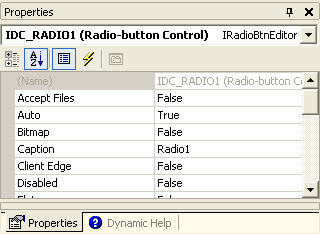
6. Right-click the Radio1 control and choose Properties from the shortcut menu.
7. Change the caption of the Radio1 control to Bar.
8. Turn on the Group property for the Radio1 control.
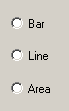
9. Select each of the other radio buttons and set their captions as follows:
— Radio1: Bar
— Radio2: Line
— Radio3: Area
NOTE >> The topmost radio button (marked "Bar") has its Group attribute set but the others do not.
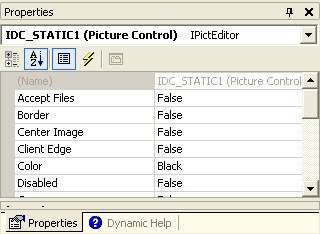
10. Open the Properties window for the Picture control.
11. Enter IDC_CHART as the ID for the Frame (instead of IDC_STATIC). This ensures that the ClassWizard will allow the selection of the ID and the addition of a control variable for it.
12. Click the Close button in the upper right corner of the Properties dialog box to close the window.
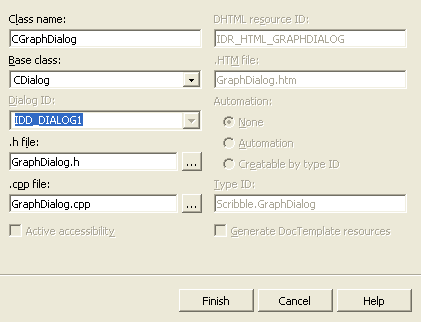
13. Complete the New Class dialog box as shown:
14. Click Finish.
15. Add member variables for the graph control and the radio button group.
16. In the code you must enter your control notification handler code for CGraphDialog::OnRadio1():
SRGraphDisplay *pD = (SRGraphDisplay*)m_GraphControl.m_Graph.GetComponent(0,IDS_SRG_DISPLAYTYPE);
if(pD!=NULL)
pD->GetStyle()->SetGraphStyle(CX_GRAPH_VBAR);
m_GraphControl.Invalidate();
17. In the Resource View, double-click on IDD_DIALOG1 in the tree to return to the dialog window.
18. Add BN_CLICKED member functions for each of the other two radio buttons as well, each time adding the appropriate control notification handler code. (See the code below.)
NOTE >> The following code creates the handlers for the radio buttons to allow the user to change the chart type when the dialog is open.
////////////////////////////////////////////////////////////
// CGraphDialog message handlers
void CGraphDialog::OnRadio1()
{
SRGraphDisplay *pD = (SRGraphDisplay*)m_GraphControl.m_Graph.GetComponent(0,IDS_SRG_DISPLAYTYPE);
if(pD!=NULL)
pD->GetStyle()->SetGraphStyle(CX_GRAPH_VBAR);
m_GraphControl.Invalidate();
}
void CGraphDialog::OnRadio2()
{
SRGraphDisplay *pD = (SRGraphDisplay*)m_GraphControl.m_Graph.GetComponent(0,IDS_SRG_DISPLAYTYPE);
if(pD!=NULL)
pD->GetStyle()->SetGraphStyle(CX_GRAPH_LINE);
m_GraphControl.Invalidate();
}
void CGraphDialog::OnRadio3()
{
SRGraphDisplay *pD = (SRGraphDisplay*)m_GraphControl.m_Graph.GetComponent(0,IDS_SRG_DISPLAYTYPE);
if(pD!=NULL)
pD->GetStyle()->SetGraphStyle(CX_GRAPH_AREA);
m_GraphControl.Invalidate();
}
NOTE >> Don't skip the next step!
19. Open GraphDialog.h. Near the top of the file insert:
#include "GraphControl.h"
Display the Dialog
Although our project now contains a dialog with a control that can display a chart, there is no way for the user to invoke it. You must add a menu command and handler to the main menu and document class, respectively.
1. From the ResourceView tab, open the Menu folder.
2. Inside the Menu folder, select the main Scribble menu (IDR_SCRIBBTYPE) and open it for editing.
3. On the Scribble menu, click View and double-click the empty space at the bottom of the submenu. This is to add another menu item, Statistics, under the View menu.
4. On the Message Maps tab, choose CScribbleDoc as the Class name.
5. Select ID_VIEW_STATISTICS (in the Object IDs field) and COMMAND (in the Messages box).
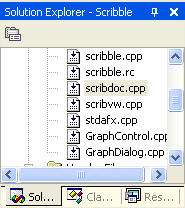
6. On the FileView tab, locate and open scribdoc.cpp for editing.
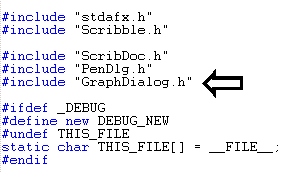
7. Before editing the handler, go to the top of the file and add:
#include "GraphDialog.h"
It should look something like this:
NOTE >> The handler for the View Statistics command must prime the chart with data before it is displayed. The logic is simple. By iterating through the list of strokes in the m_strokeList member, all the strokes are interrogated for the number of points they contain. The data are sorted into group 0 for thin strokes and group 1 for fat strokes. Data counts are used to generate index labels, and the group headers are set to provide the legends with text to display. Once the chart control has been filled with data, the dialog is allowed to run and the data are displayed.
8. The full text of the menu handler is listed below. Add the highlighted text at the appropriate location at the bottom of the scribbdoc.cpp file.
void CScribbleDoc::OnViewStatistics()
{
if(m_strokeList.IsEmpty())
return; // nothing to display
// This handler will transfer the scribble statistics to
// the dialog box and display the box
CGraphDialog dlg;
dlg.m_GraphControl.SetTitle("Points per Stroke");
// here we iterate the stroke list and gather data for the
// chart
int nThinStroke=0,nFatStroke=0; // used to number the stroke bars
for(POSITION p=m_strokeList.GetHeadPosition();p!=NULL;)
{
CStroke *pS=m_strokeList.GetNext(p);
CString s;
if(pS->GetPenWidth()<3)
{
s.Format("%d",1+nThinStroke); // stroke number for the
// annotation
dlg.m_GraphControl.SetGraphData(nThinStroke,0,
(double)pS-> m_pointArray.GetSize());
// the data is placed into the chart
dlg.m_GraphControl.SetIndexText(nThinStroke,s);
// annotate the item
nThinStroke++;
}
else
{
// stroke number for the annotation
s.Format("%d",1+nFatStroke);
// the data is placed into the chart
dlg.m_GraphControl.SetGraphData(nFatStroke,1,
(double)pS-> m_pointArray.GetSize());
// annotate the item
dlg.m_GraphControl.SetIndexText(nFatStroke,s);
nFatStroke++;
}
}
dlg.m_GraphControl.SetHeaderText(0,"Thin Strokes");
dlg.m_GraphControl.SetHeaderText(1,"Fat Strokes");
dlg.DoModal();
}
The above routine uses a function that must be added to the CStroke class. In order to sort out the thick lines from the thin ones, the stroke's pen width must be interrogated. The m_nPenWidth data member in the original Scribble code is declared as protected. Therefore, a public member function that returns the pen width is required.
9. Define the GetPenWidth() function body in scribdoc.cpp as follows:
// Added by to interrogate the pen widths.
int CStroke::GetPenWidth()
{
return m_nPenWidth;
}
10. Add one line of code to the public section of the class declaration of CStroke (in scribdoc.h):
virtual int GetPenWidth();
// Operations
public:
BOOL DrawStroke(CDC* pDC);
void FinishStroke();
virtual int GetPenWidth();
public:
virtual void Serialize(CArchive& ar);
};
11. Build (F7) and execute (Ctrl+F5) your new version of Scribble.
12. Draw several strokes, using both the thin and fat pens.
13. On the View menu, click Statistics to view the dialog box with the chart.
14. Click each of the radio buttons, one by one, to try the different graph types.
Congratulations! You have created a flexible, serviceable chart with a modest amount of code by utilizing the powerful automatic features of Objective Chart. You can use this example to create statistical chart dialogs for many applications.
In the next step, you will create a chart window and integrate it with the Scribble window.