XYOUTS Procedure
Draws text on the currently selected graphics device starting at the designated data coordinate.
Usage
XYOUTS, x, y, string
Input Parameters
x, y—Specifies the column, x and the row, y at which the output string should start. Both x and y are normally taken to be in data coordinates; however, the Device and Normal keywords can be used to change this unit.
Output Parameters
string—The scalar string containing the text that is to be output to the display surface. If not of string type, it is converted prior to use.
Keywords
Background—Fills the area behind the text with a specified color. The default, –1, indicates no fill.
Additional XYOUTS keywords are listed below. For a description of each keyword, see
Graphics and Plotting Keywords.
Discussion
XYOUTS is machine-dependent when you are using hardware fonts. This means that on two different machines, the same commands may produce text that does not appear the same. To guarantee similar appearance, use software fonts.
note | You may notice that under X Windows the size of the software fonts varies from device to device. When you start PV‑WAVE, the PV‑WAVE hardware font is set to the current hardware font of the X server. Not all X servers will have the same default font size because users can reconfigure the default font and the default font can differ between X servers. Therefore, you may discover that the hardware font size, and therefore the software font size, may vary across different workstations. Avoid this by explicitly setting the X font using the DEVICE procedure. For example: DEVICE, font='-adobe-courier-medium-r-normal--14-*' |
Example
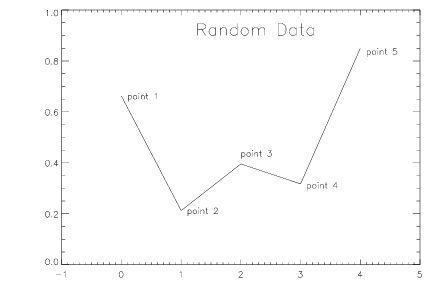
In this example, XYOUTS is used to label a plot of random data. Procedure XYOUTS also is used to place a title on the plot. Text placement is relative to the
x and
y coordinates of the plot, which is the default for XYOUTS. Note that the CURSOR procedure was used to determine the proper coordinates at which to place labels. This example uses PV‑WAVE IMSL Statistics Toolkit procedure RANDOMOPT. The results are shown
Figure 20-1: Plot Labeling on page 1979.
; Create a 5-element vector of random data.
STAT_INIT
RANDOMOPT, Set=1234567
x = RANDOM(5)
; Plot and label the data.
PLOT, x, XRange=[-0.5, 4.5]
XYOUTS, 0.1, 0.65, "Point 1"
XYOUTS, 1.1, 0.20, "Point 2"
XYOUTS, 2.0, 0.425, "Point 3"
XYOUTS, 3.1, 0.30, "Point 4"
XYOUTS, 4.1, 0.825, "Point 5"
; Place a title on the plot. Make the title twice the default
; character size using the Charsize keyword.
XYOUTS, 1.25, 0.9, "Random Data", Charsize=2
See Also
For more information on using XYOUTS to annotate plots, see the PV‑WAVE User’s Guide.
Version 2017.1
Copyright © 2019, Rogue Wave Software, Inc. All Rights Reserved.